I was curious to see if over time the type of music I listen to has changed. Have I started listening to quieter genres or more bass-heavy tracks? After a small search, it turned out Spotify conveniently provides the Spotipy python package that interacts with their Web API and allows you to tap into their datasets.
I’ve shared the Jupyter Notebook on GitHub, in case others’ are interested in similar analysis for themselves or would like to build on top of it. Give it a star, if it happens to be useful to you.
Before we get to the interesting parts, one needs to register as a developer with Spotify and create an application. It takes about 2-3 minutes to set everything up.
Registering as a developer with Spotify
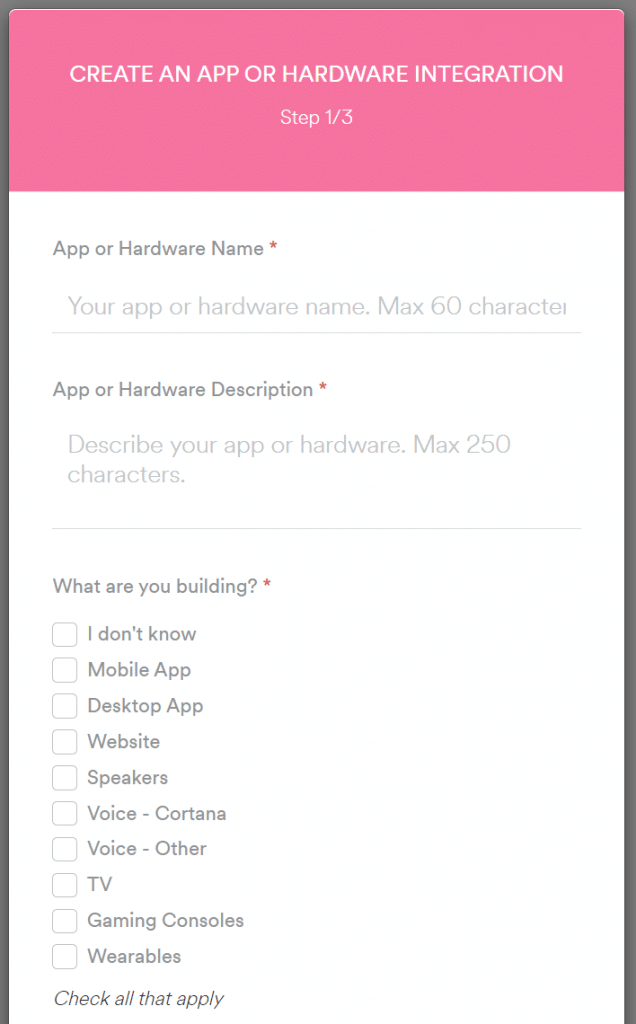
Head out to Spotify for Developers Dashboard and click on Log In and use your Spotify Account credentials. Upon authentication, click on Create a Client Id, you should see a pop up similar to the one below. Name your application, provide basic description and tick “I don’t know”, click Next.
Confirm the terms & agreement on the next screen that the app is for non-commercial use and click Submit. You should see the dashboard page with the following notification.

Click on Show Client Secret and copy the Client ID and Client Secret to a text file for a moment, DO NOT POST these anywhere online. Then go to Edit Settings at the top right and in the Redirect URI add any URL, it doesn’t have to work. As we need this to run only locally in a Jupyter Notebook, you can add http://localhost/callback and click Add. Copy that entered URL to the text file that has the Id and the Secret. We now have all the required items to authenticate and query the Spotify Web API. Hurray!
Setting up Jupyter Notebook and Spotipy
One of the fastest ways to get a working scientific python environment is to use Anaconda’s Distribution, which will install the most popular packages such as Pandas, Numpy, Matplotlib, etc. You can download it here.
Once installed, you can open the Anaconda Navigator and click Launch under the Jupyter Notebook icon. You should see a web page like the following:
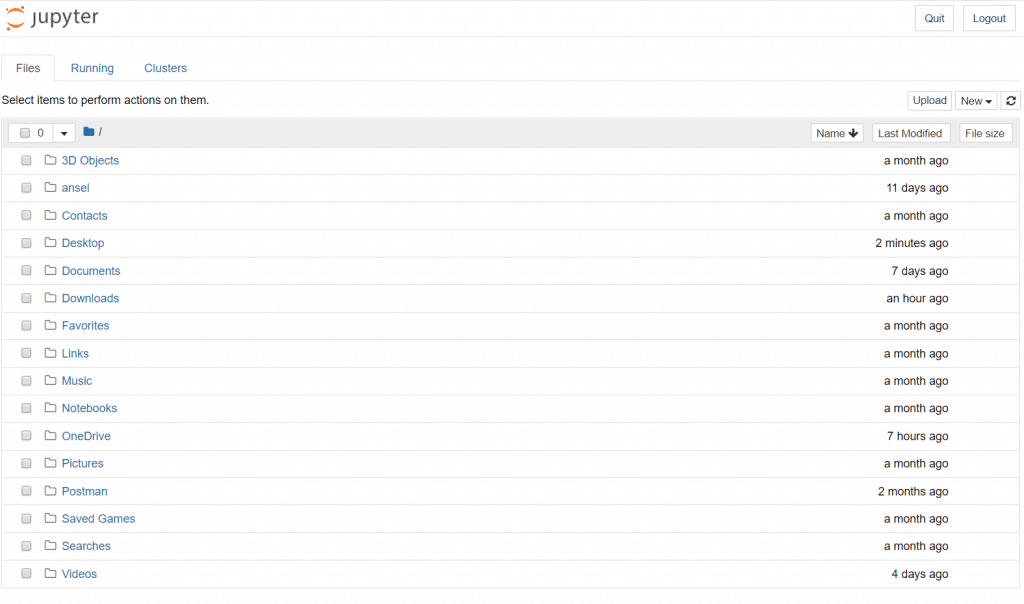
Navigate to the directory you want to work in and click New at the top right and select Python 3.
We now have an interactive python environment. Before we focus on the interesting parts, there is one more thing we need to do, which is to install the spotipy package. To do so, click on an entry cell and type
pip install spotipy --user
and press Ctrl + Enter to run the cell. If all went fine, you should see a success print line at the end. We can now focus on the interesting bits.
Fetching Audio Analytics Data
Import the libraries we’ll need
import numpy as np
import matplotlib.pyplot as plt
import pandas as pd
import spotipy
from pandas.io.json import json_normalize
At this point, you can have a look at the finished notebook in my GitHub or directly clone it.
In the cell just under Get Top Artists paste and populate the strings with your username, client Id, client secret and redirect URI from that temporary text file from earlier and run the cell (Ctrl + Enter). The template code looks like this:
username='<username>'
scope = 'user-library-read user-top-read'
client_id = '<client_id>'
client_secret = '<client_secret>'
redirect_uri = '<callback_url>'

tk = spotipy.util.prompt_for_user_token(username, scope, client_id, client_secret, redirect_uri)
When run for the first time, it should open a web page that asks to authorize the app we just registered to be able to read your music library, accept it. Then it will open an invalid page that looks like http://localhost/code=? copy the entire URL and paste in the textbox entry in the Jupyter Notebook and press Enter. Now we have our token, that allows us to query. It expires roughly every hour. So you might need to rerun this cell from to time to be continue fetching data. It will only generate the URL with the ?code= string going forward.
Now that we have the token we can instantiate a Spotify object.
sp = spotipy.Spotify(auth=tk)
At this point, you can have a look at the available calls in the API Documentation and Package Docs.
Below is the abridged version of what the notebook does, as it’s repeating the same logic for the different time frames and metrics. The purpose is just to give you a flavour on how to use it. So you can approach the analysis your own way if you wish to do so.
We can request the top 10 artists for the short-term period using:
st_artists = sp.current_user_top_artists(limit=10, offset=0, time_range='short_term')
normalize the returned dictionary and convert to a data frame with:
top_artists = json_normalize(st_artists["items"])
and we can sort by the popularity metric in descending order:
top_artists = top_artists[['name','popularity','genres', 'followers.total', 'uri']].sort_values(by=['popularity'], ascending=False)
we can do the same for the top tracks using the current_user_top_tracks method. Which returns us a track id which we can use to fetch the track’s analytics:
tracks_list_features = sp.audio_features(['<track_id>'])
the method does take a list of ids, so you can request a large list at once.
We can then aggregate by a metric, doing a weighted average by popularity using numpy:
trend_loudness['short-term'] = np.average(track_analytics['loudness'], weights=track_analytics['popularity'])
What the metrics represent is documented here.
The overall code is not perfect and has a bit of code duplication, but given its basic functionality it should suffice given our goal.
Results
Finally, we can create a small data frame to display the values over time:
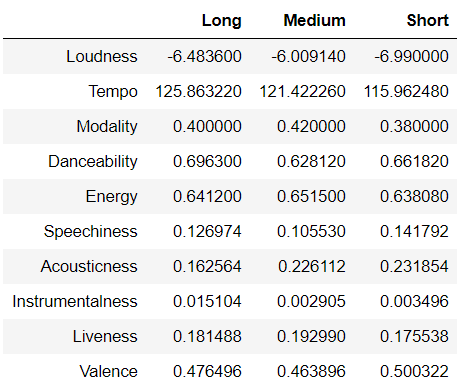
There are some very clear trends, such as that I definitely have started listening to slower songs that have more lyrics. This fits a trend I was expecting, as I’ve started listening less to Drum & Bass and more to Top 40 charts over the years. This is further confirmed by the very significant drop of Instrumentalness from 0.015 to 0.003.
The missing parts
The popularity metric is the biggest unknown, I couldn’t find any documentation for it. It looks to be some kind of a proprietary normalized metric that is sample based. As the results vary depending on the sample size requested, eg. 20 songs vs 100 songs.
Exact time frames, right now we can only query – short, medium and long terms, but what they actually represent is also a mystery. Would be quite nice to be able to see a play count over a user-specified date range, but given that Spotify are already quite generous on API call limits and data exposed compared to other music services. I’m reasonably happy with approximations.
If you think this type analysis is interesting and someone else might enjoy the post. Share away!


0 Comments